Plotly
Plotly is an interactive, open-source, and browser-based graphing library for Python
Introducció
plotly.py is built on top of plotly.js and is a high-level, declarative charting library.
plotly.js ships with over 30 chart types, including scientific charts, 3D graphs, statistical charts, SVG maps, financial charts, and more.
Entorn de treball
Crea un entorn de treball
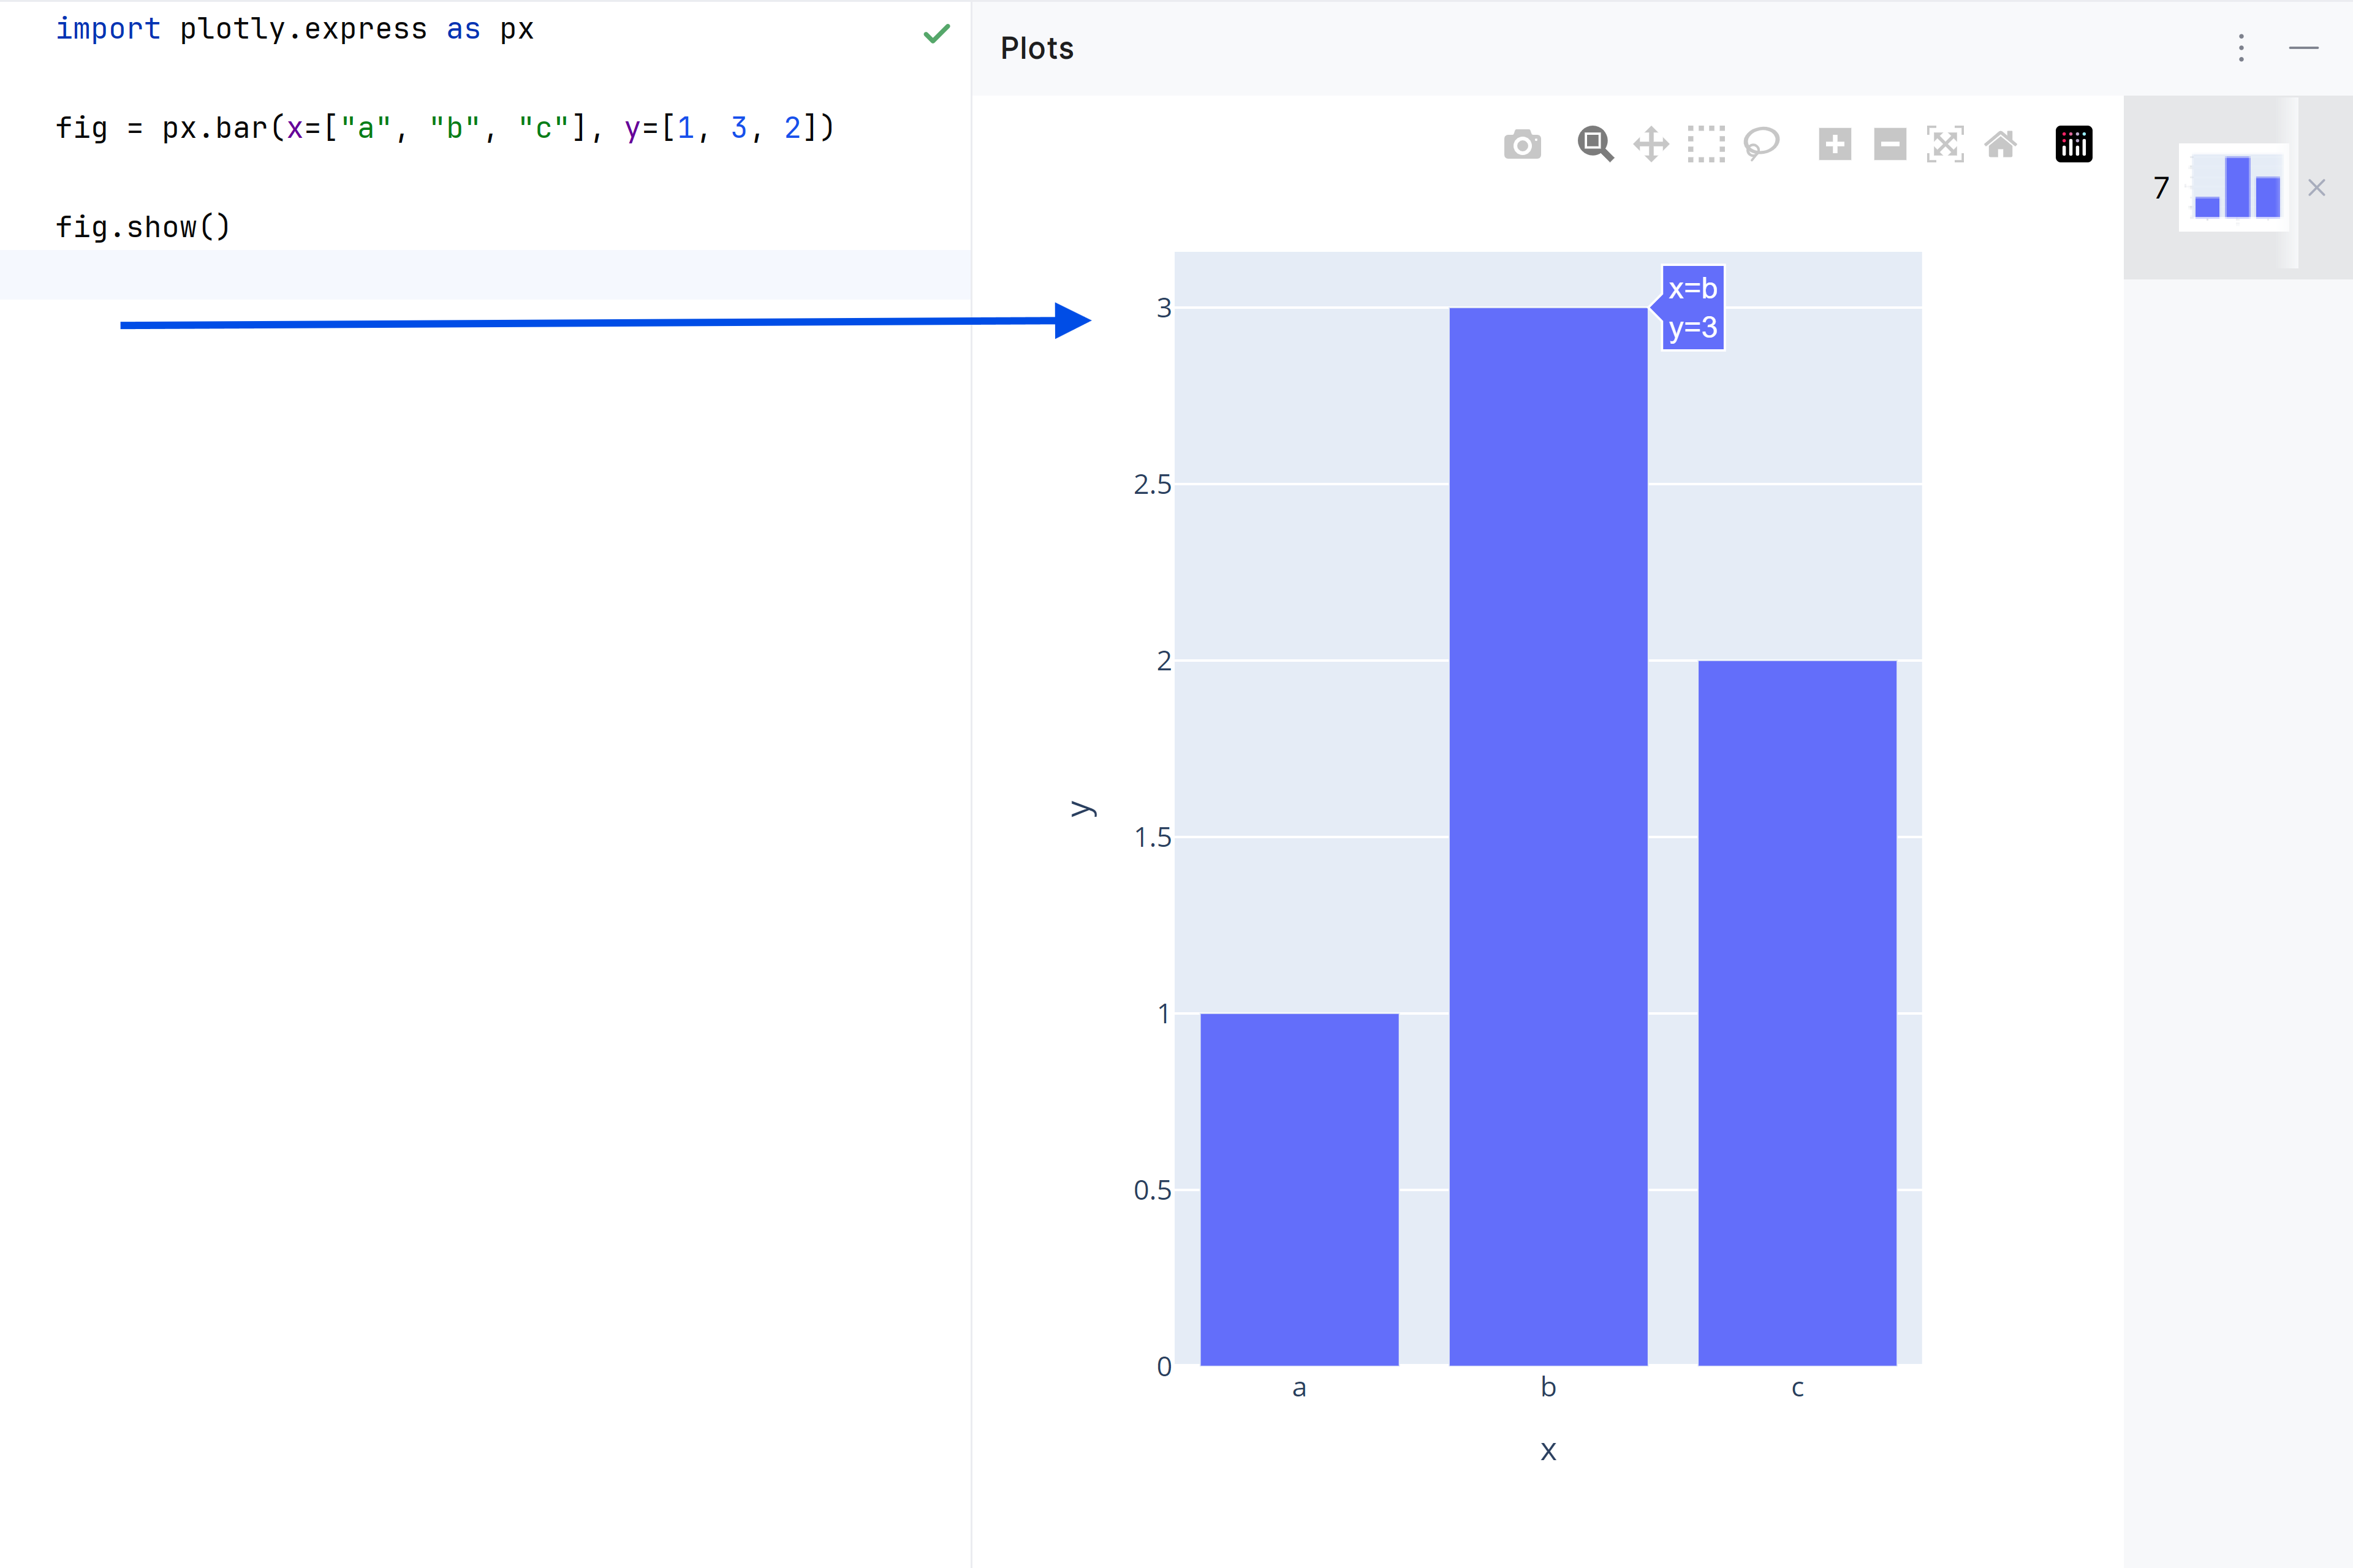
Obre el projecte amb PyCharm
Modifica el fitxer main.py:
)
En executar el fitxer, s’obre el panell Plots:
Figure
The plotly Python package exists to create, manipulate and render graphical figures (i.e. charts, plots, maps and diagrams) represented by data structures also referred to as figures.
The rendering process uses the Plotly.js JavaScript library under the hood although Python developers using this module very rarely need to interact with the Javascript library directly, if ever.
Figures can be represented in Python either as dicts or as instances of the plotly.graph_objects.Figure class, and are serialized as text in JavaScript Object Notation (JSON) before being passed to Plotly.js.
Viewing the underlying data structure for any plotly.graph_objects.Figure object can be done via print(fig). print()ing the figure will result in the often-verbose layout.template key being represented as ellipses ‘…’ for brevity.
import plotly.express as px

fig = px.bar(x=["a", "b", "c"], y=[1, 3, 2], title="sample figure")

print(fig) 'data': 'legendgroup': '',
'marker':,
'name': '',
'orientation': 'v',
'showlegend': False,
'textposition': 'auto',
'type': 'bar',
'x': , dtype=object,
'xaxis': 'x',
'y':,
'yaxis': 'y'}],
'layout': 'legend':,
'template': '...',
'title':,
'xaxis':,
'yaxis':}
})Figures also support fig.to_dict() and fig.to_json() methods.