Matplotlib
Matplotlib és una biblioteca que serveix per dibuixar figures, funcions i tota mena de gràfiques en imatges estàtiques.
Introducció
Matplotlib és una llibreria de baix nivell que serveix per dibuixar figures, funcions i tota mena de gràfiques estàtiques (en imatges png).
Funciona molt bé amb estructures de Python, arrays de NumPy , sèries i dataFrames de Polars, etc.
Tot i que hi ha llibreries estàtiques més modernes i senzilles a Python (Seaborn) i altres que ofereixen gràfics animats (Plotly, Bokeh) ens interessa aprendre com funciona Matplotlib, perquè és la que ofereix el màxim nivell de personalització i perquè totes aquestes llibreries tenen un funcionament similar a Matplotlib.
Per aquest motiu, encara hi ha molts treballs científics que presenten les funcions i gràfics amb Matplotlib.
Static plots
Although dashboards, and interactive plots, are an extremely important aspect in exploring and presenting data, there will always be a requirement for static plots.
Reports, technical papers, articles, and anything in print are always going to require static plots. Being able to quickly and easily produce clear, logical and beautiful static plots therefore remains absolutely essential.
Static plots require all the information to be displayed effectively in one view. There are no dynamic overlays, or zooming and panning, to help gain further information on the fly like you might see in a dashboard or interactive plot.
As the old saying goes “a picture can convey a thousand words”. However, the CAN in that statement is very important! If the plot is poorly constructed, the message definitely will not be conveyed effectively.
Background
Matplotlib has been around since 2003!
It is fairly ubiquitous in the field of data science, and it would be fair to say that a lot of people have a love-hate relationship with it. It is very flexible, but can also get quite involved.
A quick recommendation
One of the major reasons for confusion (or straight up hate!), at least in my opinion, is that Matplotlib actually has two different interfaces:
- the “pyplot” interface, which is intended to be simpler to use for quick plots
- the “Axes” interface, which is much more flexible, and uses an Object Oriented Programming (OOP) approach
The “Axes” interface is actually pretty easy to use, and much more flexible. I would therefore encourage anyone using Matplotlib to just learn “Axes” interface (also sometimes referred to as an API.
For more on the differences between the two interfaces (or APIs), please see here:
API Reference – Matplotlib 3.8.2 documentation
Entorn de treball
Crea un nou projecte amb Uv:
Modifica el fitxer main.py:
=
Executa el fitxer:
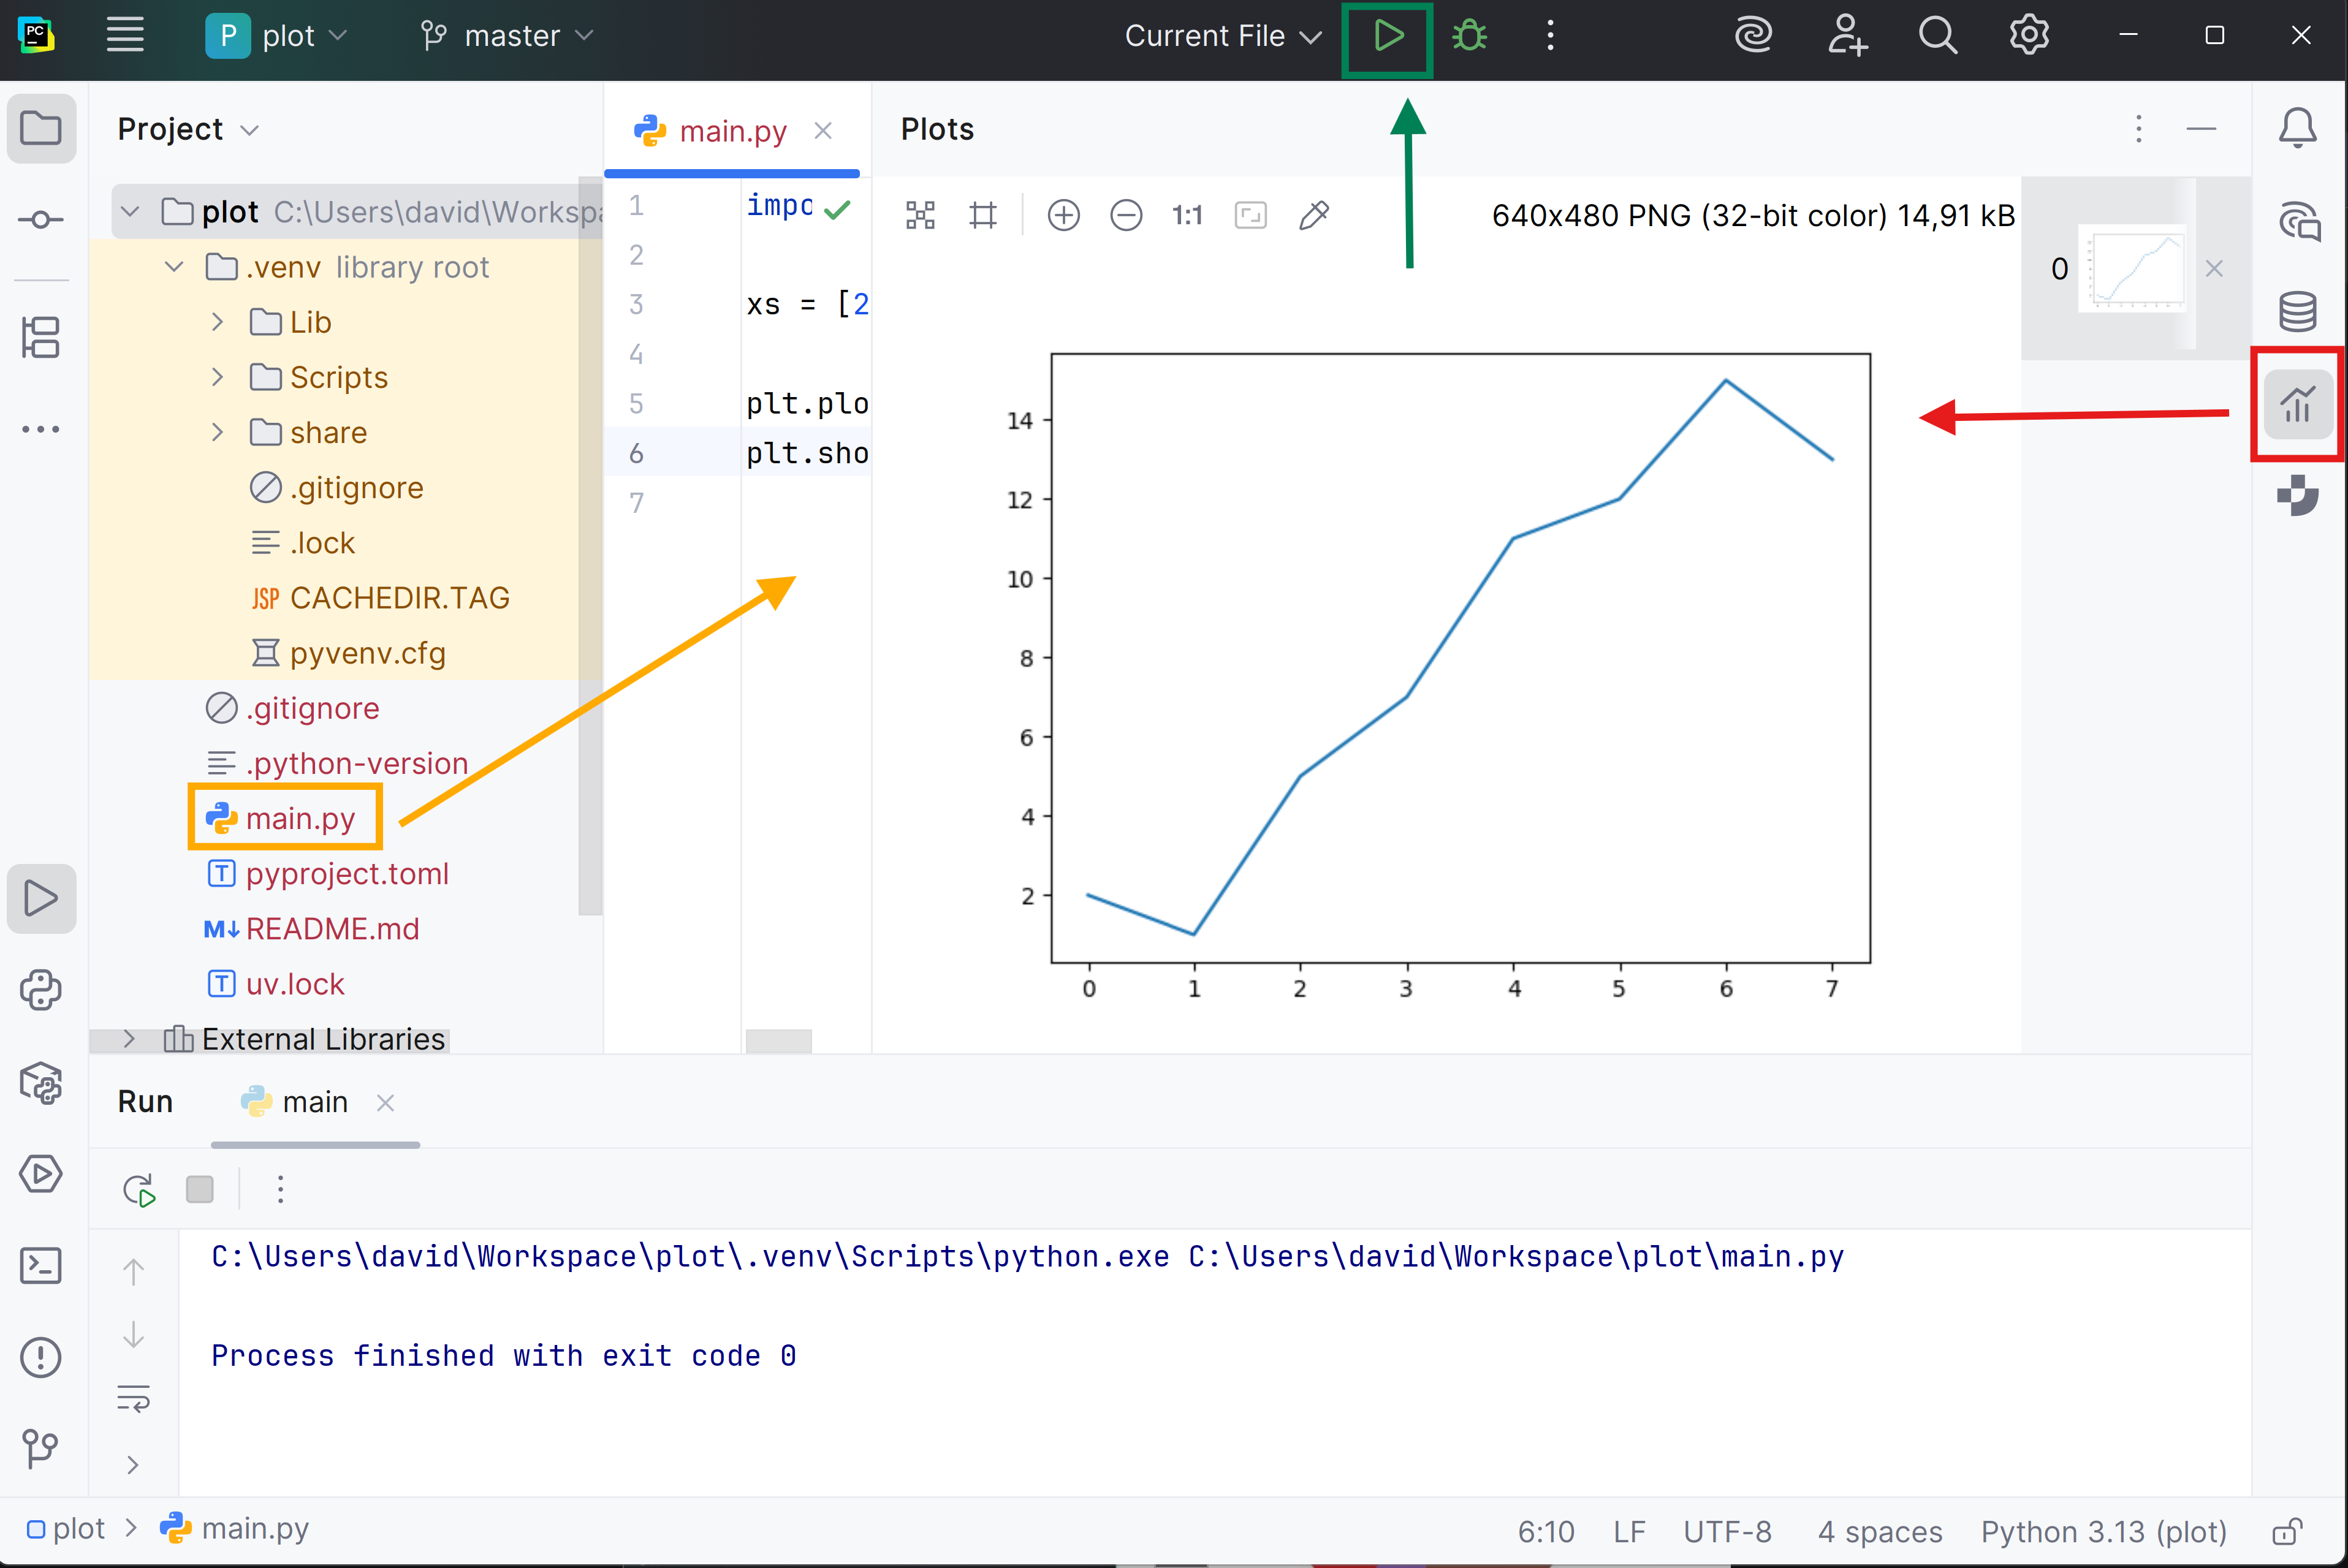
Pots veure que quan s’executa plt.show() s’obre un panell amb el gràfic
Una altra opció és guardar el gràfic en un fitxer amb savefig:
=
Obre el fitxer plot.png:
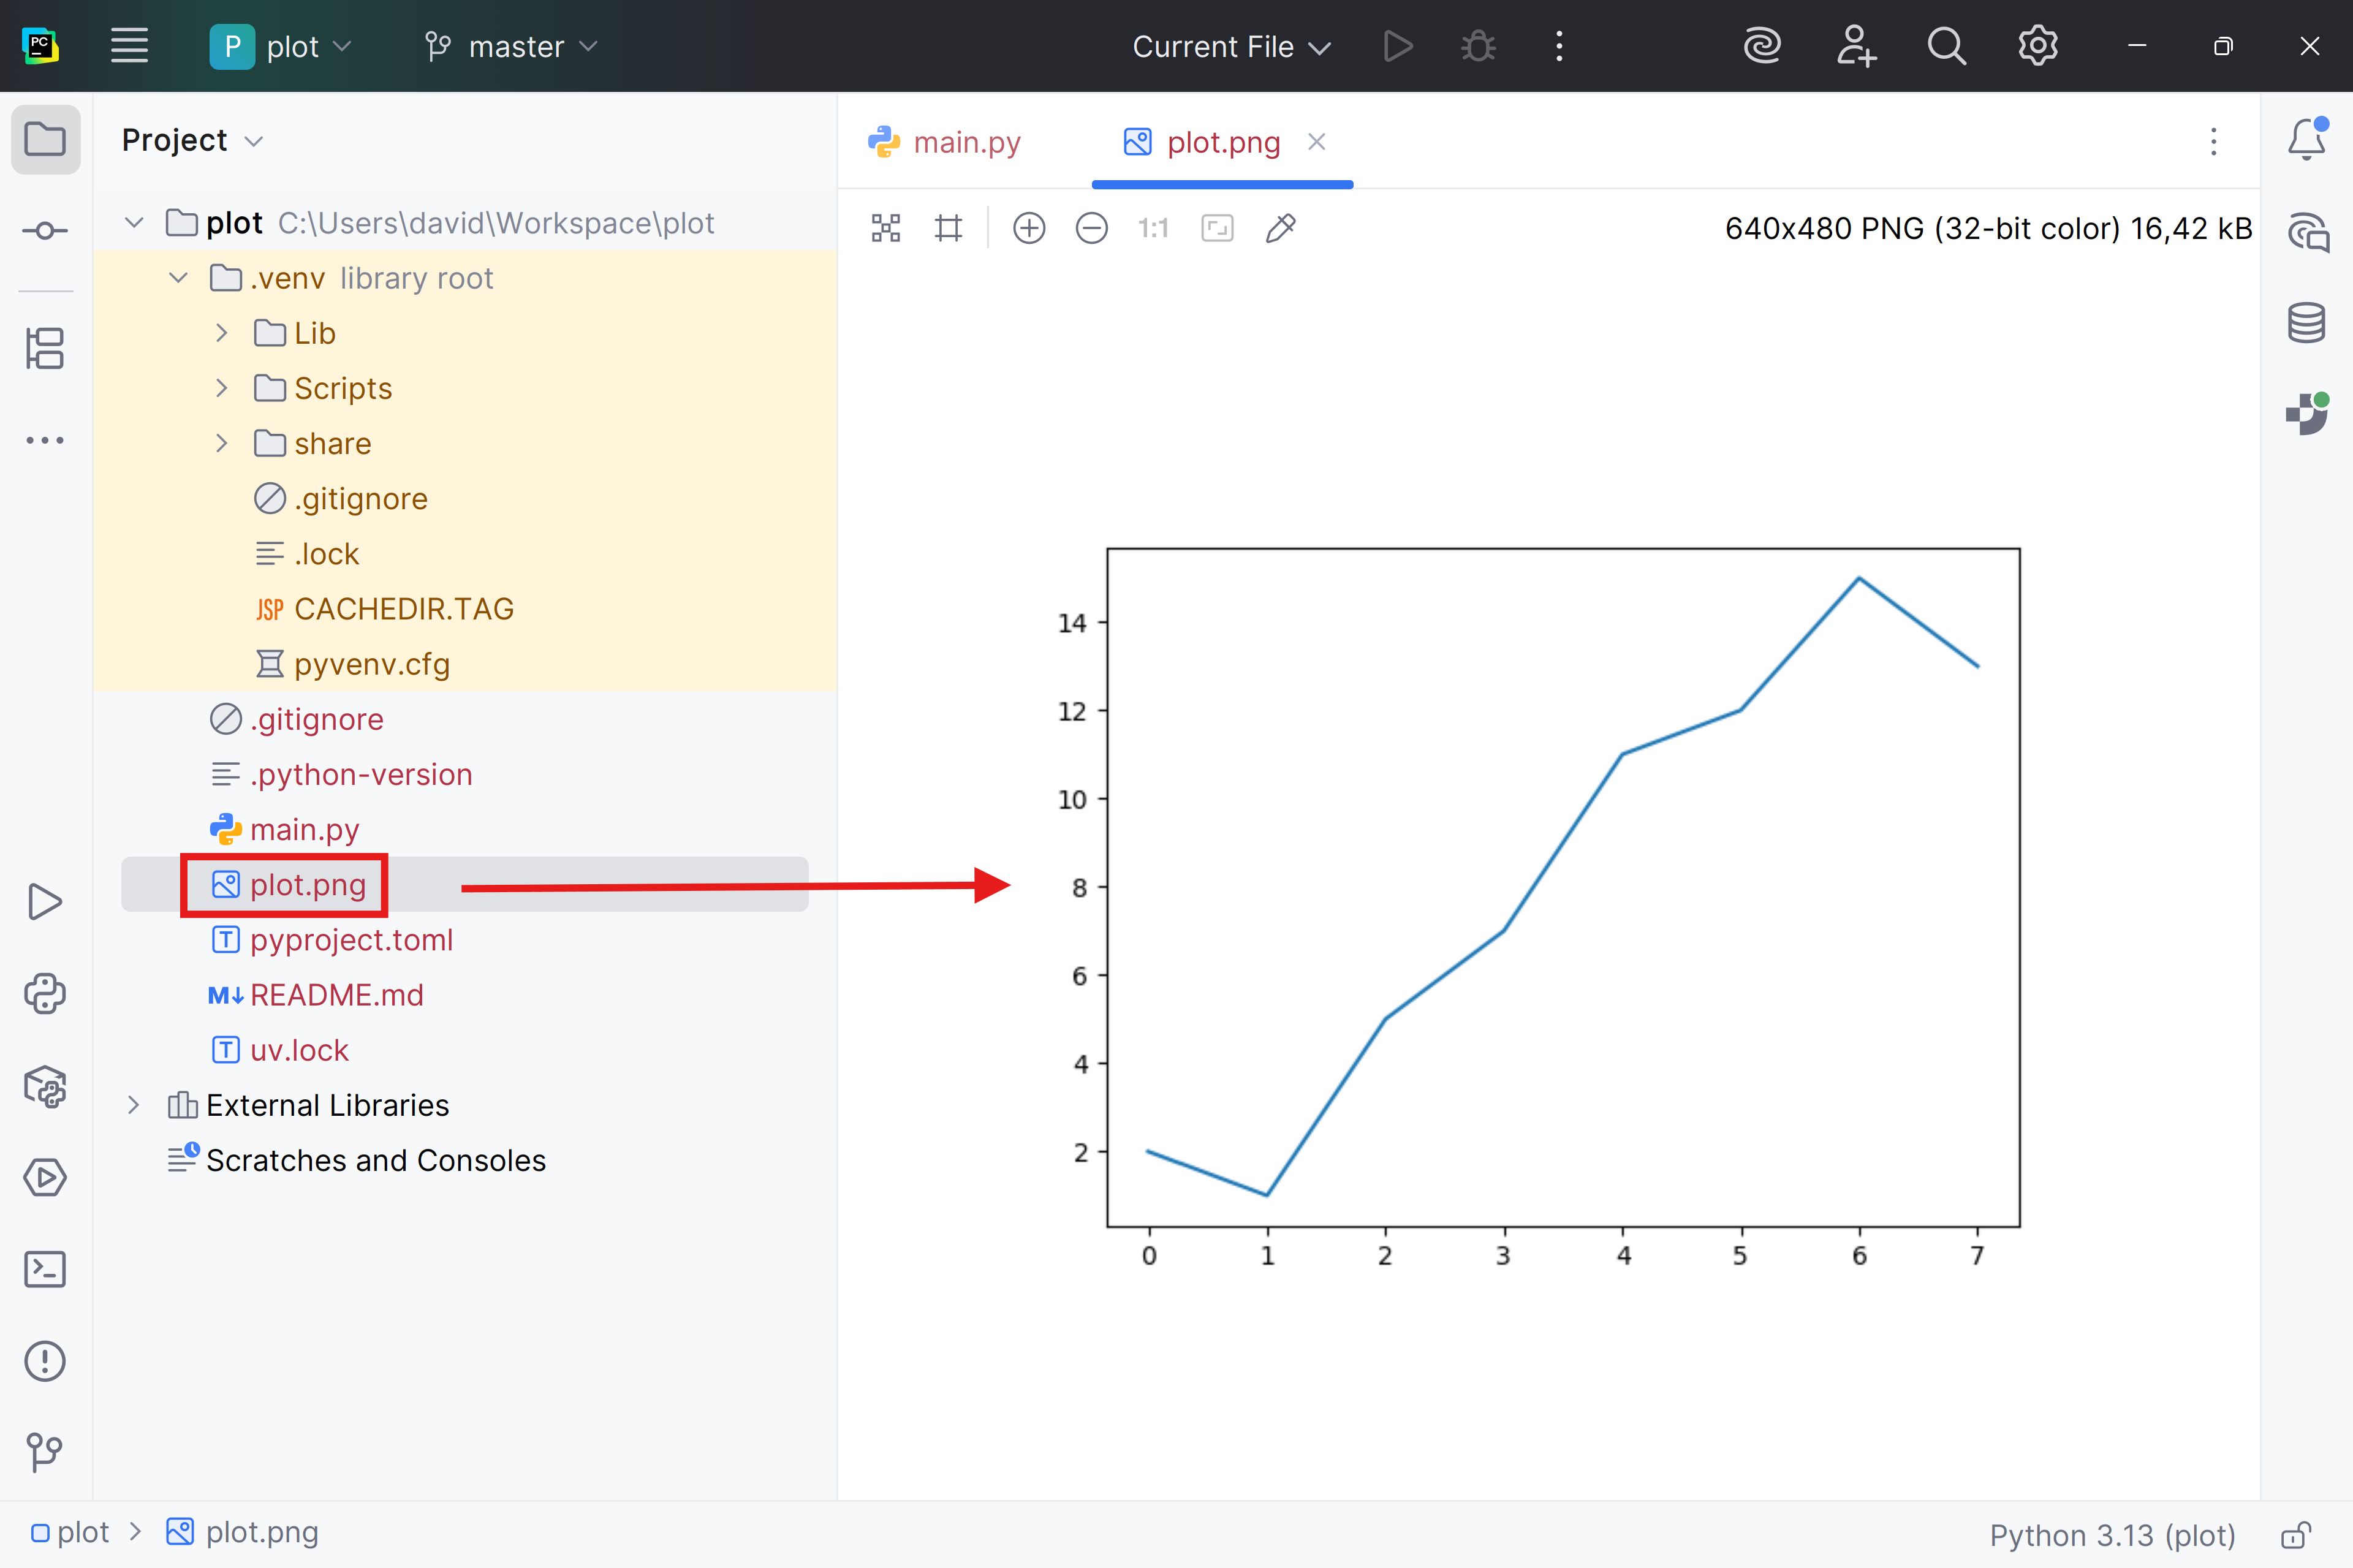
Pots veure que s’ha generat un gràfic de la seqüència xs.
Crear gràfics de senzills amb el mètode plot()
El gràfic més senzill que podem crear és una línia a partir d’una matriu plana (1D) o una llista.
En importar, ja creem un contenidor (un canvas = un llenç) dins de l’objecte plt.
El mètode plot és el que dibuixa el gràfic dins del contenidor plt.
Si no li diem res més, crea un gràfic de punts amb les dades de la llista que li hem passat.
=
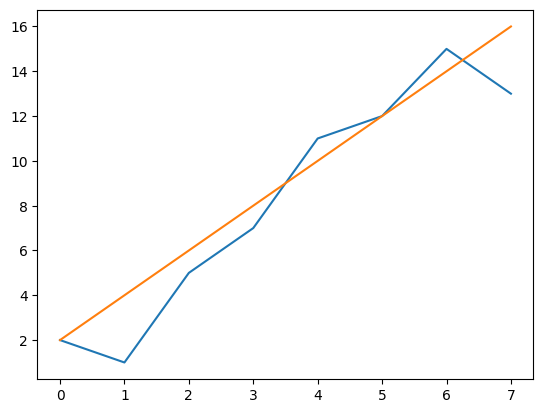
També podem crear un gràfic amb diverses línies (una des d’un array 1D i una altra des d’una línia)
=
=
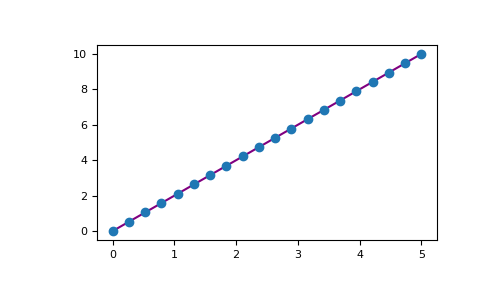
També pots veure com crear una matriu i dibuixar una recta i posar-li punts a damunt.
=
=
# linia
# punts
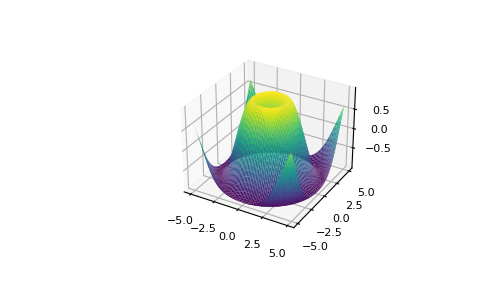
Amb Matplotlib, pots accedir a un enorme ventall d’opcions de visualització 2D i fins i tot 3D. En aquest cas mostrem una ona sinusoidal radial.
Com a curiositat, aquesta funció es pot descriure matemàticament com:
Z = sin(R) on R = sqrt{X^2 + Y^2}
Desglossem-ho una mica més:
-
Rés la distància euclidiana (equivalent al teorema de Pitàgores) des de l’origen (0, 0) fins a qualsevol punt ((X, Y)) en el pla. -
La funció
sin(R)pren aquesta distància radial i calcula el valor del sinus d’aquesta distància.
Les ones sinusoidals radials són útils per modelar fenòmens que es propaguen radialment des d’un punt central, com ara les ones de calor o electromagnètiques.
Aquest tipus de visualització només la mostrem com a demostració del potencial de la biblioteca.
=
=
# Vectors de coordenades
=
=
# Els transformem a matriu de coordenades.
, =
# Apliquem les funcions
=
=
Paràmetres bàsics de la funció plot()
Els més importants i comuns en tots els gràfics són:
x | Estructura de dades (llista, diccionari, array, dataframe …) on es troben les dades a dibuixar. Necessari. |
y | Dimensió Y per figures 2D i gràfics de funcions que representin linies (siguin rectes o no) o punts en un pla. |
z | Dimensió Z per gràfics 3D. |
color | Color dels punts/rectes/figures. |
label | posem llegenda a la línia. |
fmt | format. Si tenim números decimals |
Si no li diem res, la funció infereix els paràmetres (sobretot els x, y que són molt habituals), però és bona pràctica especificar paràmetres.
A part dels paràmetres de la funció plot, tenim altres mètodes importants dins el contenidor del gràfic (plt en el nostre cas).
Els més bàsics són els que mostren les etiquetes dels eixos i del títol del gràfic.
- ylabel(“Etiqueta eix vertical”)
- xlabel(“Etiqueta eix horitzontal”)
- title(“Titol gràfic”)
- legend() –> Mostra una llegenda de les funcions o barres
- grid() –> Mostra una graella per facilitar la visió
I com fer el gràfic més gran o més petit? Podem usar aquest mètode abans de mostrar o guardar el gràfic, que indica les proporcions:
Gràfics de línies.
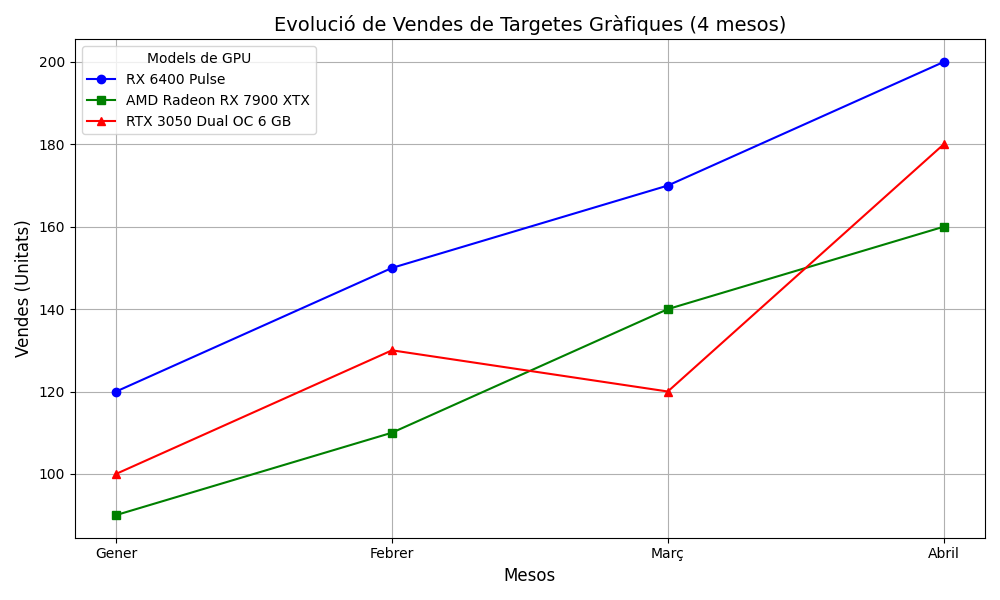
Usant els arrays de Numpy i llistes, podem crear gràfics de diverses línies.
Per exemple, l’evolució de vendes de 3 models de targetes gràfiques en 4 mesos.
# Dades fictícies de vendes de 3 models de targetes gràfiques en 4 mesos
=
=
= , # RX 6400 Pulse
, # AMD Radeon RX 7900 XTX
# RTX 3050 Dual OC 6 GB
])
# Crear el gràfic de línies utilitzant l'array de Numpy
# Marcadors i colors per cada línia
=
=
# Crear el gràfic de línies amb un bucle
# Afegir títol i etiquetes
# Mostrar el gràfic
Aquesta solució és correcta i escalable (si afegim mesos o productes funciona igual)
1. Crea un gràfic amb 3 línies que representin la evolució del seu nivell de glucosa a la sang en mg/L que tenen 3 pacients amb grip i amb 7 columnes, una per dia; guardat en numpy.
Pots inserir manualment les mostres o bé generar-les aleatòriament; l’important és que siguin dades versemblants de persones hospitalitzades.
Una possible manera de definir les dades és la següent:
# Dades de glucosa per a tres pacients en 7 dies.
=
= ,
])Fes que vegi una llegenda i/o la descripció del gràfic i els seus eixos, així com diferenciar cada pacient per un color diferent.
Una presentació suggerida del gràfic:
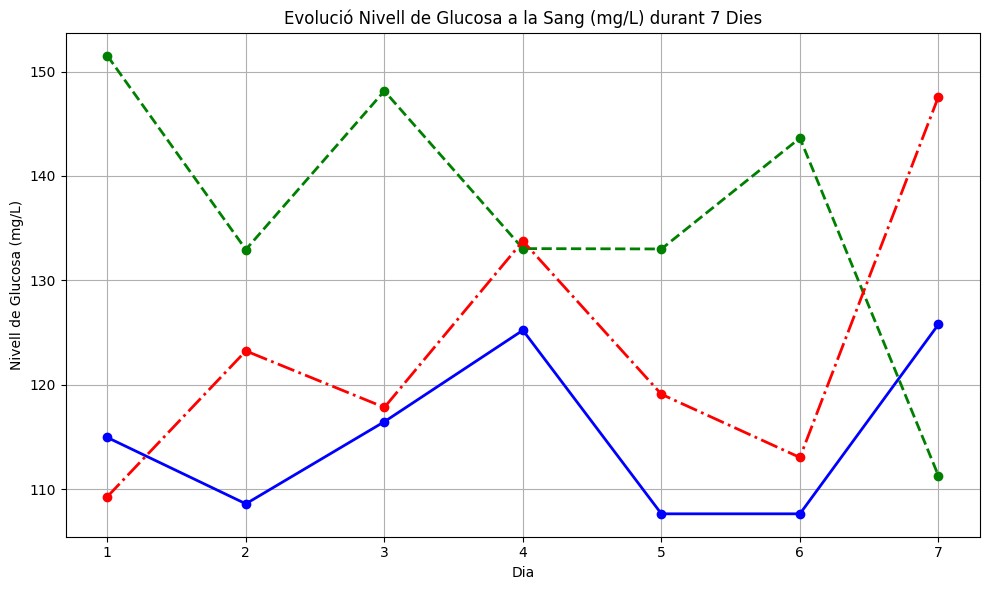
Show solution
Opció 1. Més senzilla, amb dades realistes.
# Dades de glucosa per a tres pacients
=
= ,
])
# Gràfica de línies (eix x--> dies, eix y--> pacients)
# Afegir títol i etiquetes
# Afegir una graella
# Mostrar la gràfica
# plt.show()
Opció 2. Conté subgràfics (opcionals en aquest cas) amb dades realistes generades aleatòriament.
# Configuració dels pacients i dels seus paràmetres
= 3
=
# Definició dels rangs per a cada pacient
= # valor mínim de glucosa
= # valor màxim de glucosa
=
=
=
# Generació de dades aleatòries
=
]
# Creació de la figura
, =
# Gràfica de línies
=, =)
# Mostrar el gràfic
Diagrames de barres
Com els altres gràfics, es pot fer sense Numpy i aplicant el que hem après amb els diagrames de línies.
Aquests diagrames són molt adequats per mostrar les freqüències d’aparició de cada valor d’una variable.
Per exemple, els gols número de gols de cada jugadora o el número de d’aparicions de cada nucleòtid (A,C,G,T) en una cadena d’ADN.
# Dades del gràfic
=
=
=
=
=
=
# Creem el gràfic.
=
#plt.legend(title='Jugadores')
# Només si vols usar Collab (ipynb)
#plt.show()
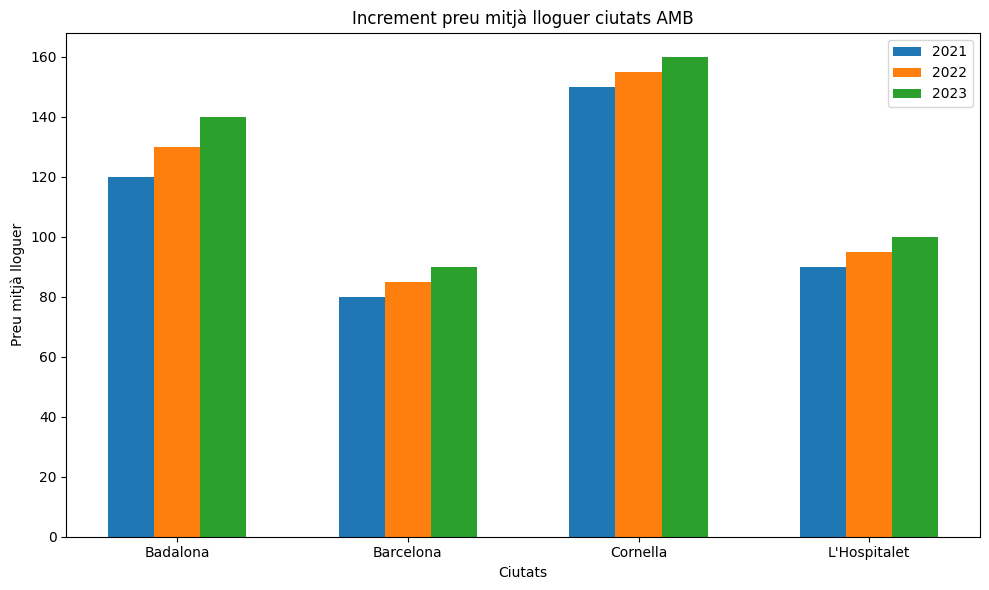
Diagrames de barres agrupats
Amb Matplotlib i Numpy, també podem fer diagrames de barres agrupats; de manera semblant a com hem fet abans gràfics de diverses línies.
Per exemple, suposem que volem veure l’increment dels preus dels lloguers a ciutats de Catalunya.
Les posarem en un array de Numpy, on a l’eix Y hi haurà cada ciutat (Badalona a l’index 0, Barcelona a l’1…) i al de les X els anys (del 2021 al 2023, per exemple)
Les dades del gràfic les hem tret del dataset del preu mitjà dels lloguers als municipis de Catalunya (les hem preprocessat prèviament).
=
=
= , #Badalona
, #Barcelona
, #Cornella
#L'Hospitalet
])
# Generem el diagrama de barres per cada any
, =
# Ample de les barres
= 0.2
# Posicions de les barres per cada any
=
# Creem les barres per cada any
# Configuració del gràfic
# Ajustar la visualització
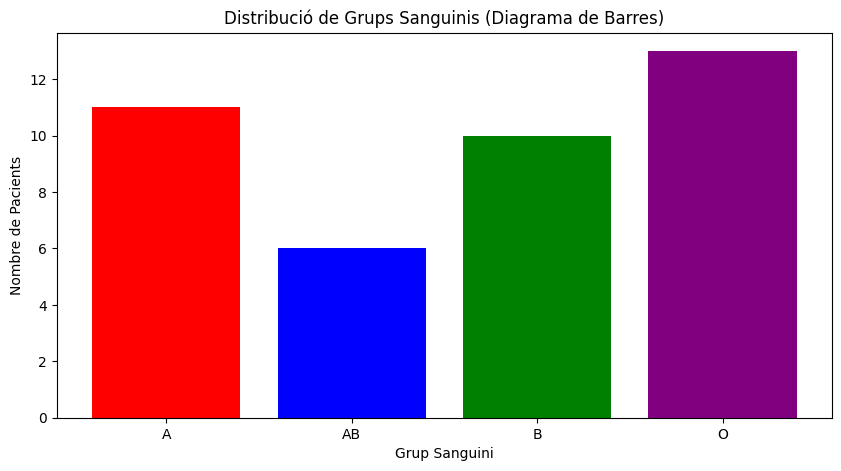
Classificació de mostres
Tingueu en compte que no sempre us vindran les dades “curades” i en ocasions tindreu, per exemple 100 observacions i les haureu de classificar d’alguna manera: per gènere, per edat…
Suposem que tenim en un array (o llista) els grups sanguinis de 40 pacients (A, O, AB, B) i volem fer un gràfic del número de pacients de cada grup.
Amb la funció de np.unique aconseguim aquesta agrupació.
Veiem-ho:
# Definir els grups sanguinis possibles
=
# Generar aleatòriament els grups sanguinis per a 40 pacients
# Fixem la llavor per a reproduir els resultats
=
# Agrupar les mostres per tipus.
, =
=
# Diagrama de barres
# Diagrama de sectors
Les parts més interessants i novedoses del codi es troben al principi:
- Es generen les dades aleatòriament.
- Encara més important, aquestes línies que guarden els valors únics (unique) i el nombre d’ocurrències (counts)
- Al final ho guarden tot en un diccionari, per conveniència (però potser no caldria)
# Agrupar les mostres per tipus.
, =
= 
Ja sabem el més bàsic de generació de gràfics: la selecció de dades.
2. Crea un diagrama de barres que mostri la freqüència d’aparició dels 4 nucleòtids (A, C, G i T) d’una cadena d’ADN.
= Show solution
=
=
# Comptem les freqüències de les lletres A, C, G i T en una sola passada
+= 1
# Diagrama de barres
Heatmaps
Els heatmaps o mapes de calor són una alternativa molt útil als diagrames de barra compostos, per tal de veure totes les freqüències d’aparició de cada variable.
Generen una taula bidimensional amb els valors de 2 variables, on la llegenda de colors de les dades més altes les marca d’un color intens (pex vermell) i les més baixes d’un altre color oposat (pex blau).
Veiem-ho amb un exemple que ja vam veure a la secció de Numpy: el fitxer CSV de les temperatures de Barcelona dels últims 8 anys
Suposarem que ja hem carregat les temperatures dels últims 8 anys i generem el gràfic:
= ,
,
,
,
,
,
,
]
=
# Separar les columnes per a les etiquetes dels anys i les temperatures
=
=
# Crear el heatmap anotat
, =
=
# Afegir la barra de color
=
# Afegir anotacions
# Configurar les etiquetes
# Ajustar les etiquetes de l'eix X (mesos)
# Ajustar les etiquetes de l'eix Y (anys)
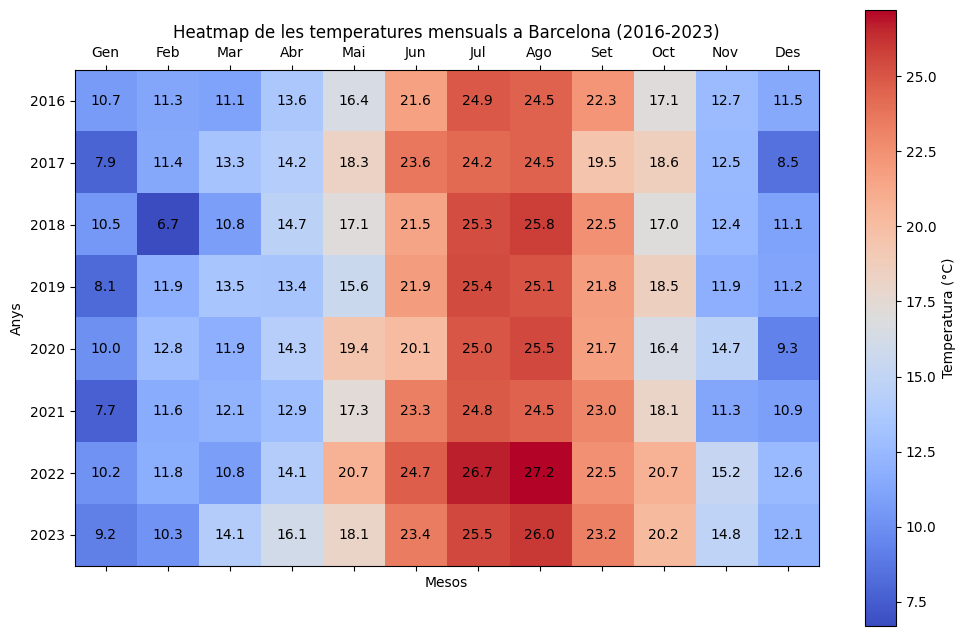
Però a la vida real no tindrem les dades tan curades, haurem de carregar-les d’un o més fonts i preprocessar-les.
En el nostre cas, necessitem descarregar-nos les dades si no les tenim al disc (connectar-se a una altra URL té un cost computacional i ambiental considerable).
Recordeu com podem aconseguir aquesta descàrrega i lectura de fitxers CSV que són en una URL externa: Fitxers
Un cop les tenim, carreguem les dades de les temperatures en un array, i filtrem únicament les 8 últimes.
Guardem els últims anys (2016 - 2023) en un vector 1D separat de les temperatures (si no, tindrem errors ja que els arrays han de ser homogenis).
La resta de passos, per a generar el gràfic, són els mateixos.
El codi final queda així:
# Per a ipynb:
# !pip install nptyping
: =
: =
# Descarregar el fitxer CSV només si no existeix
# Lectura del tot el fitxer CSV excepte la capçalera
=
# Seleccionem les últimes 8 files de temperatures (2016 - 2023)
# Separem la columna dels anys i la eliminem de l'array de temperatures.
=
=
# print(temps_array)
# print(anys_array)
# Crear el heatmap anotat
, =
=
# Afegir la barra de color
=
# Afegir anotacions i etiquetes
# Ajustar les etiquetes de l'eix X (mesos)
# Ajustar les etiquetes de l'eix Y (anys)
# Canviar el número de ticks a 8 (les últimes 8 files)
El resultat del gràfic és el mateix, però el resolem amb un codi útil en més contextos i mantenible.
3. Crea un Heatmap a partir de l’exemple dels preus de lloguer, en vermell els preus més alts i en verd els més baixos.
El codi de partida és el següent:
=
=
= , #Badalona
, #Barcelona
, #Cornella
#L'Hospitalet
])
Show solution
: =
: =
= , #Badalona
, #Barcelona
, #Cornella
#L'Hospitalet
])
# Em ve de gust trasposar la matriu per presentar millor el heatmap.
=
# Crear el heatmap anotat
, =
# Catàleg colors a:
# https://matplotlib.org/stable/users/explain/colors/colormaps.html
=
# Afegir la barra de color
=
# Afegir anotacions
# Configurar les etiquetes
# Ajustar les etiquetes de l'eix X (ciutats)
# Ajustar les etiquetes de l'eix Y (anys)
Scatter Plot
Els scatter plots són gràfics de punts en un pla (2D) o espai (3D). Podem pintar aquests punts de diversos colors o formes si usem subplots. Això als científics els va molt bé per a classificar a mostres d’individus o espècies per dues característiques que puguin tenir relació (per exemple, podem fer un mapa de punts de 2 colors: home i dona; tenint en compte la seva alçada i pes).
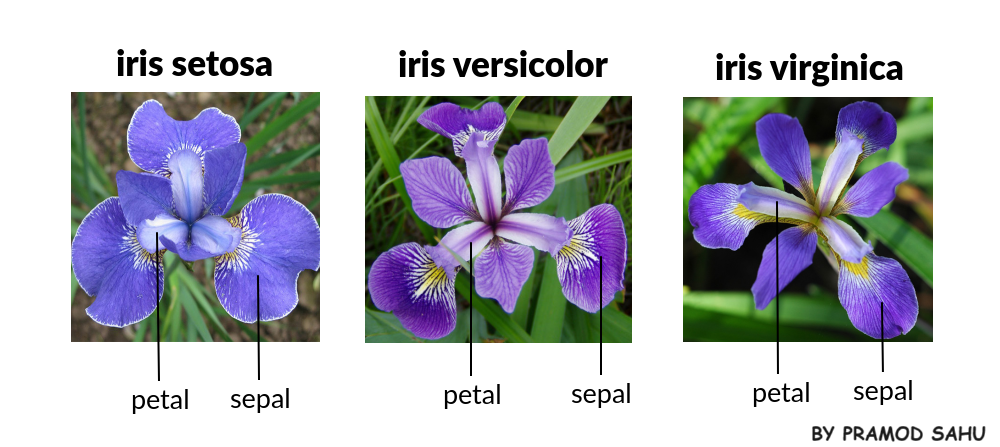
Però millor ho veiem amb un dataset d’exemple mostra les diverses espècies de la planta Iris. Aquest conjunt de dades, de 50 plantes de 3 espècies i 4 característiques importants, és un recurs típic per introduir-nos al data science.
: =
: =
# Verificar si el fitxer ja existeix localment
# Descarregar el fitxer si no existeix
=
# Llegir les dades del fitxer CSV amb NumPy
=
= # Saltar la fila de capçaleres
# Ho llegirà com array d'strings per evitar errors.
=
# Convertir les dades a arrays 1D de Numpy amb tipus ben definit.
=
=
=
# Crear un subgràfic de punts per a cada espècie (n'hi ha 3)
# Recorrem les espècies úniques i dibuixem els punts corresponents
# Seleccionem les longituds de pètals i sèpals per a l'espècie actual
=
=
# Dibuixem els punts per a aquesta espècie amb l'etiqueta corresponent
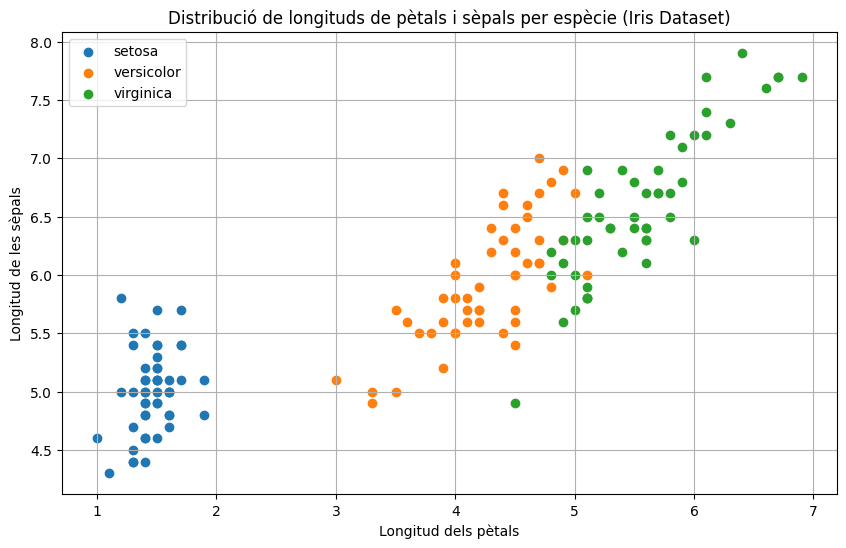
Amb aquest gràfic, podem deduïr que la Iris Setosa sol tenir els pètals més petits respecte a les altres 2 espècies i la Virginica els més grans.
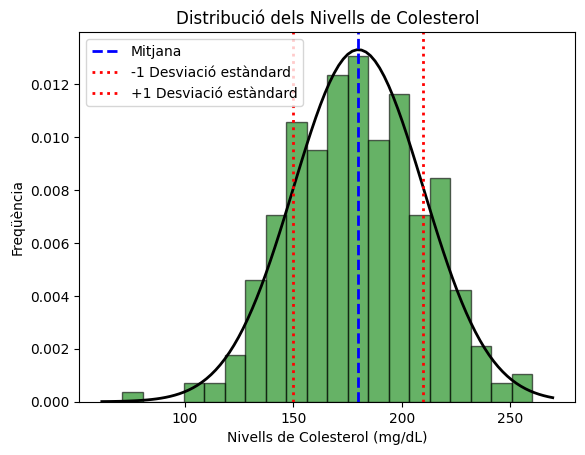
Histogrames i corbes de distribució normal.
Una de les tasques més comuns en estadística (tant descriptiva = dades, com inferencial = probabilitats) és generar gràfics per veure quina distribució presenten les dades un cop sabem la freqüència de cada ocurrència d’una variable; i gràcies a Numpy i Matplotlib podem generar aquest gràfic molt fàcilment.
Una de les distribucions teòriques més utilitzada a la pràctica és la distribució normal, també anomenada distribució gaussiana en honor al matemàtic Carl Friedrich Gauss.
Ara veurem la potència que té Numpy per a generar una col·lecció de dades que segueixen la distribució Normal i Matplotlib per a dibuixar tant un histograma per veure la distribució i una línia per veure com s’assembla la distribució que tenim respecte la Normal.
Provem aquest exemple fictici del nivell de colesterol a la sang de 300 pacients.
# Paràmetres per a la distribució normal
= 180 # mitjana del colesterol (mg/dL)
= 25 # desviació estàndard (mg/dL)
= 300 # nombre de mostres
# Generar dades aleatòries amb una distribució normal
=
# Crear l'histograma
# Crear la corba de distribució normal
, =
=
= /
# Afegir títol i etiquetes
# Afegir línia vertical a la mitjana
# Afegir línies verticals als intervals de confiança (±1 desviació estàndard)
Exercicis. Gràfics anàlisi de la qualitat de vins.
El dataset de qualitat del vi (Wine Quality Dataset) és un conjunt de dades molt utilitzat en l’anàlisi de dades i el machine learning.
Conté informació sobre les característiques físiques i químiques dels vins, així com les puntuacions de qualitat que han rebut en tests de tast.
Pots trobar el resum del dataset a la seva web oficial: https://archive.ics.uci.edu/dataset/186/wine+quality
De totes les columnes, les que ens interessa guardar per a les gràfiques que farem són:
| 9 | pH (els vins són àcids, el seu PH pot oscilar entre 2.5 i 4.5) |
| 11 | alcohol (en %, sol oscilar entre 9 i 15) |
| 12 | quality (puntuació entre 0 i 10) |
Primer, creem un mòdul d’utilitat wineutils.py per llegir (i descarregar només si cal) els fitxers:
=
=
# Comprovar si la petició ha estat exitosa
return
=
return Ens han demanat els següents gràfics per tal d’analitzar la qualitat dels vins que tenim:
4. Crear un gràfic de dispersió (scatter plot) que mostri la relació entre dues característiques del vi, per exemple, el contingut d’alcohol i la puntuació de qualitat. Pots provar qualsevol altre mesura, com el PH.
Show solution
=
=
=
=
# Seleccionar les columnes d'alcohol (column index 10) i qualitat (column index 11)
= # Contingut d'alcohol
= # Puntuació de qualitat
# Crear el gràfic de dispersió
# plt.show() No funciona sempre.
5. Crear un histograma que mostri la distribució de la puntuació de qualitat dels vins i afegeix la corba de distribució normal.
Show solution
=
=
=
=
# Seleccionar la columna de qualitat (column index 11)
= # Puntuació de qualitat
# Paràmetres per a la distribució normal
=
=
# Crear l'histograma
# Crear la corba de distribució normal
, =
=
= /
# Afegir línia vertical a la mitjana
Gràfics a la web amb FastAPI
A continuació veurás com servir els gràfics que has generat via web.
Clona el projecte https://gitlab.com/xtec/python/matplotlib
> git Obre el projecte amb PyCharm:
Ara, prova de mostrar algún dels teus gràfics a la web. 📈📊